
The stock market’s drop since the New Year has got many traders talking of a possible major correction or even a crash.
An official correction is defined as a 10% drop from the peak.
So far, at their lowest points, the Dow has fallen 7.5% and the S&P 6.1% from their peaks. That is not a correction. In fact stock markets have not had a 10% correction since 2011.
Interestingly, last Friday stocks completely shrugged off yet another disastrous jobs report and rallied.
Question is… is the sell-off done and have we bottomed?
Let’s take a look at this weekly chart of the S&P 500:
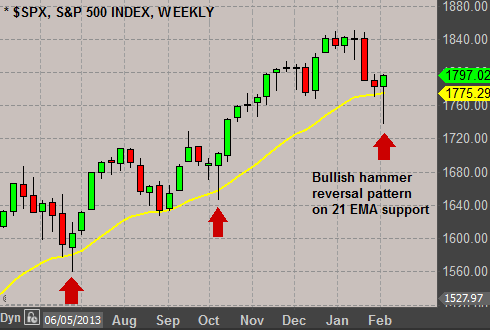
We can see that last week stocks penetrated the important support level at the 21 EMA (yellow line), but failed to close below it. The S&P has now formed a hammer candle pattern.
In technical analysis, such a “hammer” pattern which forms over support after a drop, is considered a bullish reversal. Previous times that this pattern occurred, stocks bottomed then rallied.
What about the January “bad omen” that the media has been talking about? Take a look at this 4-hour chart:

The “January omen” is that if stocks have a negative month in January, then the rest of the year will be bad for stocks.
January was a down month this year. Therefore, based on this “omen”, we should probably expect a negative year. Right?
Not really. The January omen has NO historical reliability. Besides, the January “omen” is negated when stocks go above the January lows – and stocks did just that on Friday and closed above the critical 1775 level (see above chart).
This is yet another sign that stocks have bottomed.
The smart money is not too worried either…
For the past few weeks JP Morgan has been advising clients to “stay the course and buy the weakness” rather than brace for a bigger 10% correction.
However, there is one thing which has me slightly concerned:

As you can see, the Japanese yen still remains in a minor uptrend. If stocks have bottomed, then we need to see the yen falling – at least below its 21 EMA (yellow line).
If the Japanese yen continues to surge higher (above red line) then this will be very bad for stocks and we shall see more selling pressure coming through.
Meanwhile, traders can wait for a pullback on the S&Ps to the 1775-1780 level to go long, with a hard stop either below the January lows or the February lows at 1737.
Good investing.
Pingback: If History Repeats, This is What Stocks Will Do Next... | Leadingtrader.com